L5 was originally defined as high-resolution with dimensions of 2000×3000 pixels. Subsequently, L4, L3, L2, and L1 were introduced, with L1 being the smallest size. In practice, this translated to L5, L3_5, L2, and L1. L3_5 was introduced as a screen-adapted size. L4 and L3 have not been in practical use. Images in the respective sizes were placed in catalogs with these names, such as L5, etc. In the raw material, there may be other catalogs as well, such as L5R, which contain untreated L5 jpg files. If there are also RAW or NEF catalogs present, these will contain raw files from Sony and Nikon, respectively. In recent years, L6 has also been adopted because the images are so large that in practice, a downscaled L5 is used, but there is a desire to have access to the highest resolution as well.
Scanned material varies in size based on the size of the negatives. Film is scanned at 2400 DPI, determined based on time spent and resolution. We observe the film’s grain structure and thus extract most of the negatives. Scanned 6×7 material is approximately 6000×5000 pixels and is stored untouched in a catalog named L6R, L6, or L6K, where L6, L6R, or L6K indicates contrast-enhanced images.
L6 – largest image files, where applicable
L5 – width approximately 3000 pixels
L3_5 – width 1135 pixels
L2 – height 256 pixels
L1 – height 128 pixels
Immediately after photography, the images are copied to a disk. A catalog is established with a sequential number and a brief description of the contents. The images are then placed directly into a catalog, for example, L5R. Subsequently, the file names are changed to the sequential number series used. After this, a backup is performed. Only after this is done are the memory cards formatted.
Assignment of project numbers and image numbers is done in a spreadsheet. The number of images is entered manually, and the image numbers are used to verify the quantity.
Datasets
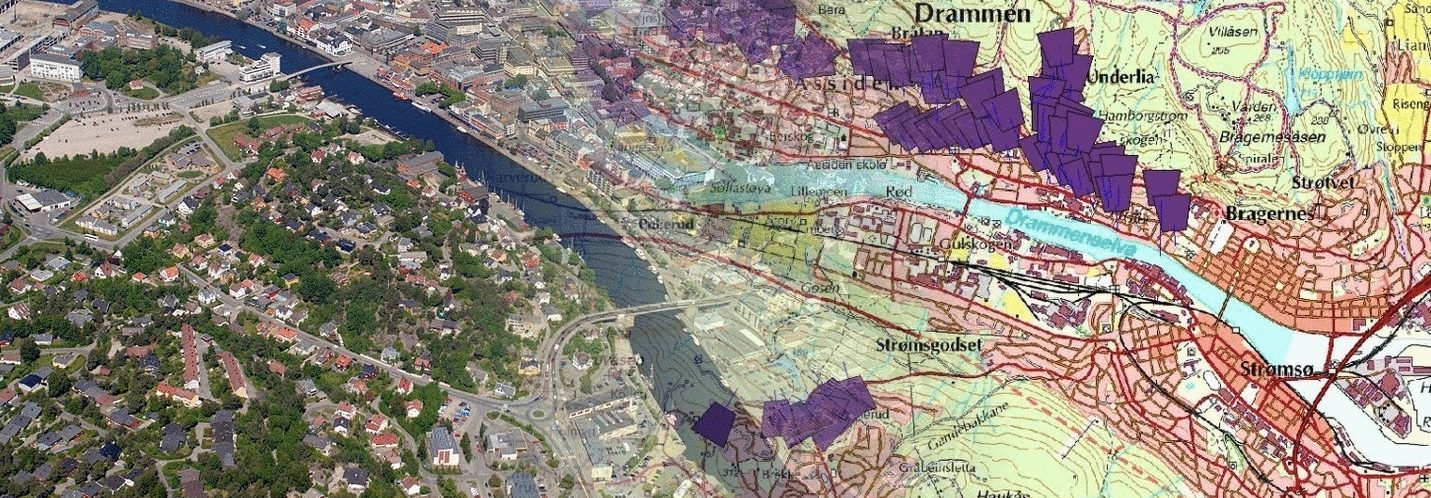
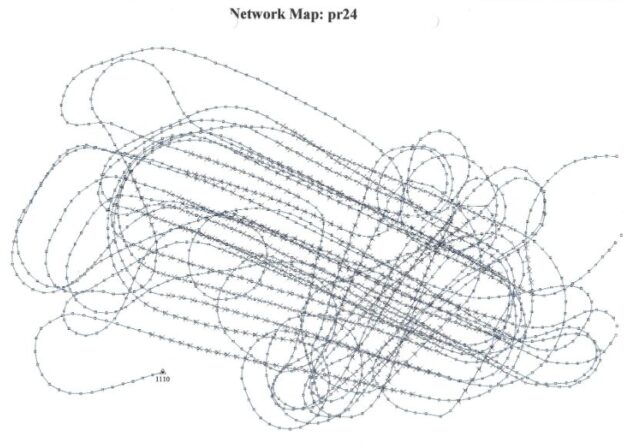
The datasets associated with or contained within the image files vary. Scanned files are initially devoid of EXIF and IPTC data (standard data structures in image files). From 1996, some data is external to the files or contained within the image files. This data is used to place the images on the map and provide the direction in which the images were taken.
End Product
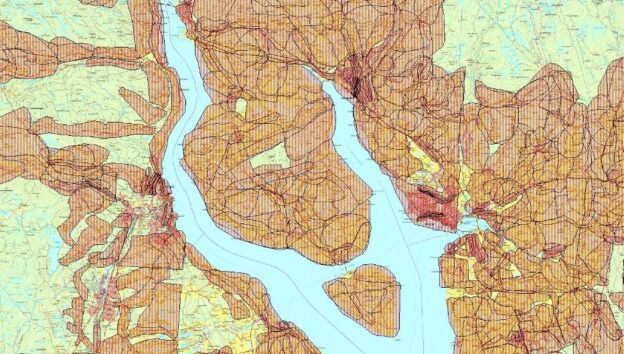
After positioning the images in GIS, images and datasets are stored by municipality, according to a standard setup. The dataset can be stored in WGS zone 32, WGS zone 33, as well as associated SOSI files. All image formats are generated.
Images and data are structured as follows, under the county with county number: 03
As the counties and municipalities receive new numbers, these are added under these numbers during updates.
Then, with municipality number and name: 03 – Oslo + Continuing year, image types, image catalogs, and metadata.
The images are normally in JPG format. Additionally, there may be catalogs containing so-called “raw” files. Scanned material will usually contain raw scans in an L6R catalog.
This end product is in data formats known as industry standards